Plotly 饼图

我们将讨论饼图并使用 Plotly 的 pie() 函数创建它。 Plotly 饼图 饼图在包含不同颜色切片的圆形图中表示数据。饼图中每一块的大小取决于数值数据的比例。 饼图用于研究数值数据的比例。它显示了数据占整体的百分比。 如果一个数量在给定数据中的比例较高,则其切片大小和百分比将大于饼图中的其他切片。我们必须在 pie() 函数内传递一个数据框或值和标签数组,以创建给定数据的饼图。
2022年5月14日
Plotly
Plotly Plot
最热门文章
Plotly 3D 散点图
2023年1月30日
Plotly
Plotly Plot

Plotly 甘特图
2023年1月30日
Plotly
Plotly Plot

Plotly 等值线图
2022年5月14日
Plotly
Plotly Map

Plotly 箱型图
2022年5月14日
Plotly
Plotly Plot
Plotly 饼图
2022年5月14日
Plotly
Plotly Plot
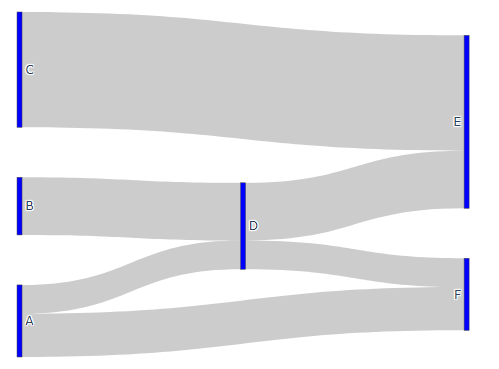
Plotly 桑基图
2022年5月14日
Plotly
Plotly Plot
最近更新的文章

plotly 小提琴图
2023年1月30日
Plotly
Plotly Plot
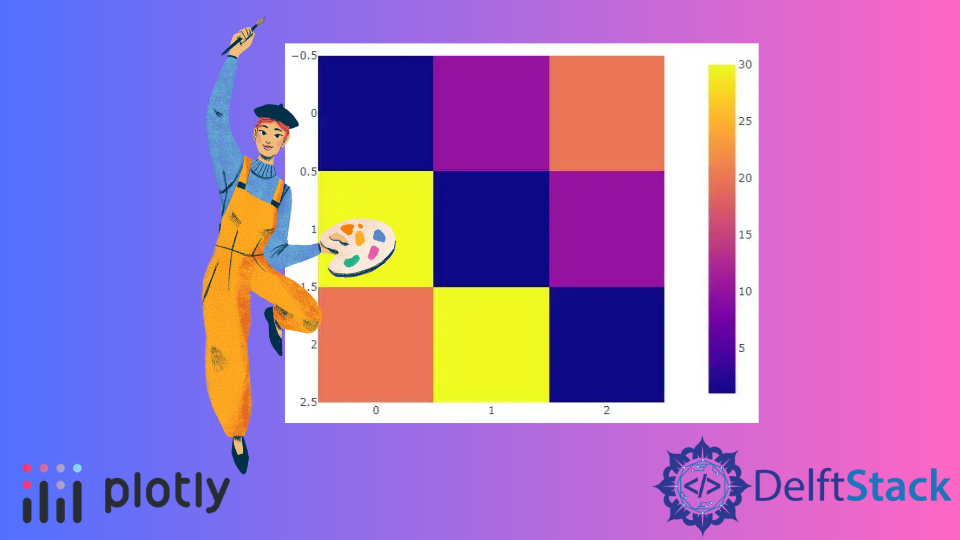
Plotly 热图
2023年1月30日
Plotly
Plotly Plot
Plotly 甘特图
2023年1月30日
Plotly
Plotly Plot
Plotly 3D 散点图
2023年1月30日
Plotly
Plotly Plot
Plotly 直方图
2022年5月14日
Plotly
Plotly Plot
Plotly 箱型图
2022年5月14日
Plotly
Plotly Plot

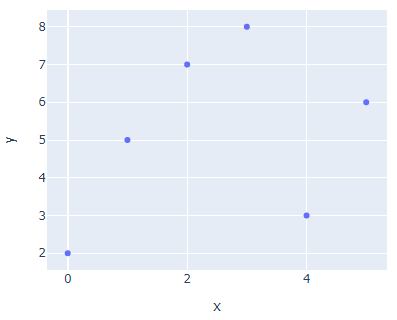
Plotly 线形图
2022年5月14日
Plotly
Plotly Plot

Plotly 条形图
2022年5月14日
Plotly
Plotly Plot

Plotly 树状图
2022年5月14日
Plotly
Plotly Plot